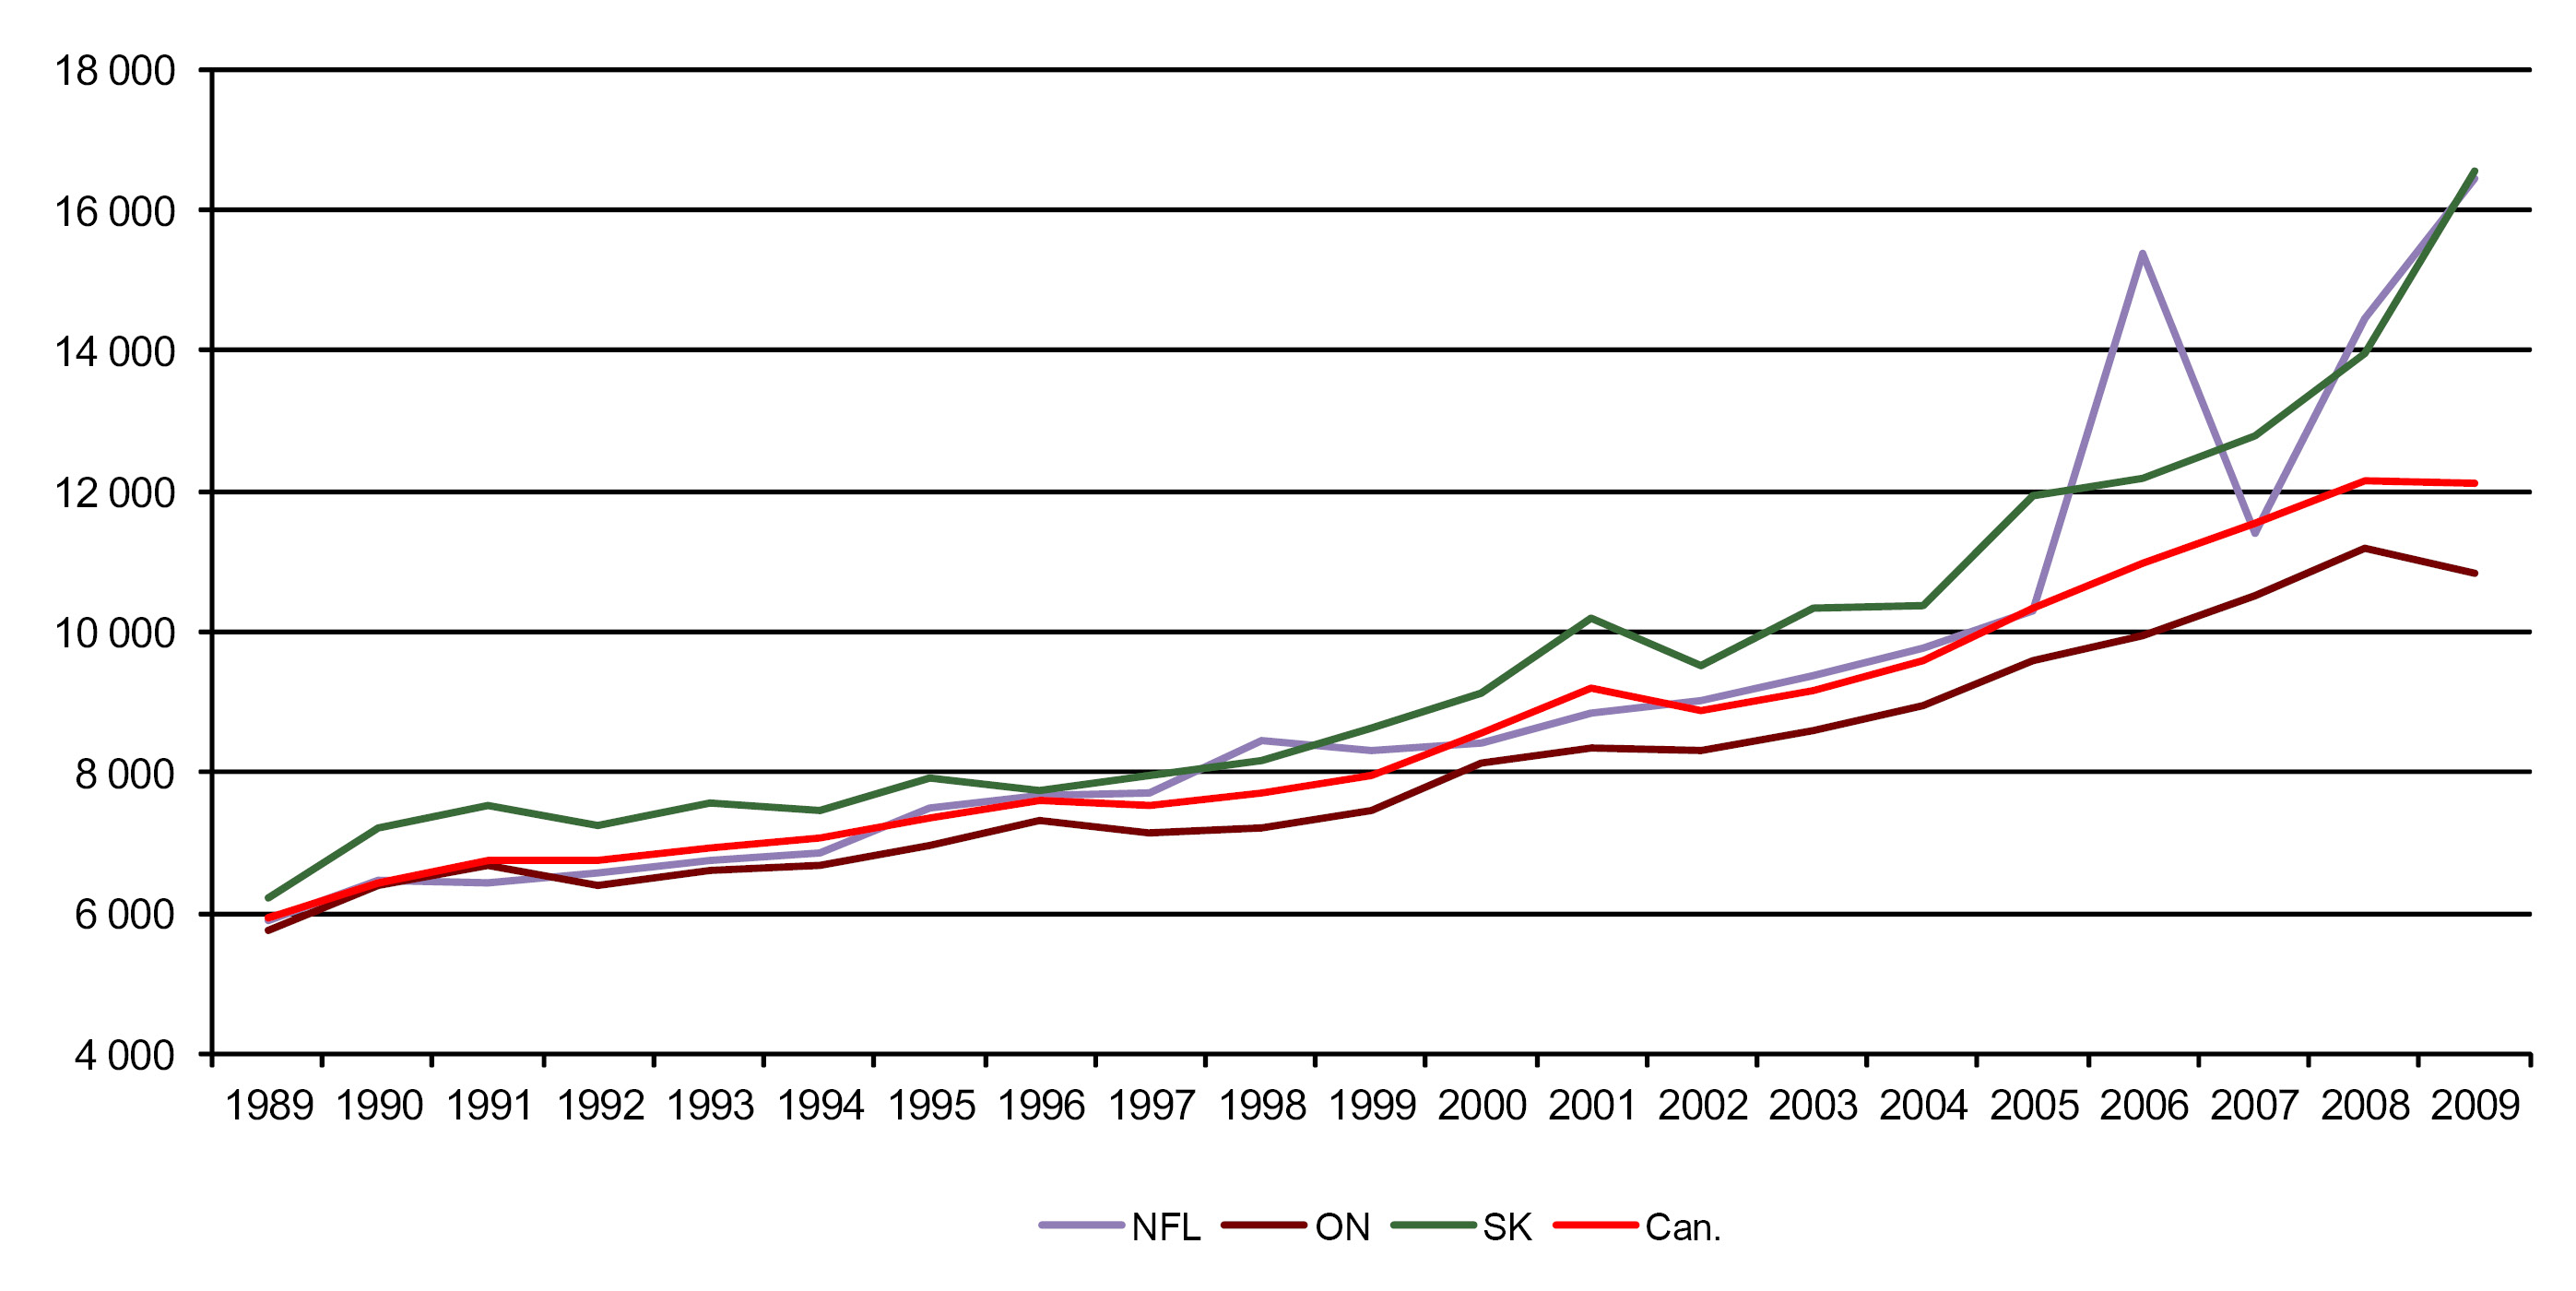
Consolidated revenues of provincial and local administrations (dollars per capita)
Calculations based on Statistics Canada, E-STAT, Tables 385-0001, updated on July 5, 2010 (for revenues) and on July 6, 2010 (for population).
The curves illustrating changes in consolidated revenues of provincial and local administrations, expressed in dollars per capita, show a relatively constant increase in revenues between 1989 and 2009. During this period, two provinces saw their revenues increase by considerably more than 100% – namely, Newfoundland and Labrador (146%) and Saskatchewan (169%). As a result, these provinces present variations that are much stronger than those seen for all of Canada, where, during the same period, the consolidated revenues of provincial and local administrations grew by 104%. In Ontario, revenues increased nearly 89% between 1989 and 2009, making it the only one of these three provinces to post a result below the Canadian average. Based on the results of Canadian provinces, it is clear that increases in government revenues have quickly outpaced the growth of their respective populations.
Furthermore, an in-depth analysis shows that types of revenue sources vary rather strongly from one province to the next. In effect, personal income tax made up 20.7% of revenues in Ontario in 2009 whereas it accounted for 11.2% in Saskatchewan and 10.7% in Newfoundland and Labrador. During this period, the Canadian average was 18.3%. The government of Ontario’s share of its revenues due to corporate income tax is also significant. Thus, in 2009 corporate income tax accounted for nearly 5% of Ontario’s total revenues, far above the average for Canada (4.6%), Saskatchewan (3.9%) and Newfoundland and Labrador (3.5%). All told, Ontario is the province in which the proportion of taxes to total revenues is highest. Considering all types of income tax (personal and corporate income tax, mining and logging taxes, taxes on payments to non-residents), Ontario is the province in which such tax accounted for the greatest share of total revenues in 2009 (25.8%). For Canada, the average in 2009 was 23.4%.
Finally, considering the proportion of all tax revenues (income taxes, tax revenues, property taxes, capital tax, payroll tax, licences and permits, and natural resource taxes) to total revenues in 2009, Ontario continues to rank first among all Canadian provinces, at 48.5%. During the same period, this proportion was 38.6% in Saskatchewan, 21.9% in Newfoundland and Labrador and 41.8% in Canada as a whole. It should be noted that in the case of Newfoundland and Labrador, the share of federal transfers in total revenues is particularly strong, which explains why tax revenues account for a lesser proportion of total revenues. In Saskatchewan, 24.1% of its revenues derived from investment income – a figure considerably higher than the average recorded for Canada, which was 9.8%.