Public Employment

LOCAL GOVERNMENT WORKFORCES


According to Statistics Canada, in 2010 the number of employees of local governments (that is, administrations such as municipalities, which discharge several public service functions, as opposed to public administrations specializing in the delivery of educational services or health and social services) stood at 274,008 persons in Ontario and only 858 in Prince Edward Island. Owing to the considerable range of nominal values applying to provincial employment data, two (2) indicators must be used in order to appropriately account for the relative size of local administration workforces in Canada’s 10 provinces – namely:

  • the number of local employees per 1000 inhabitants, which provides an indication of the capacity of local public administrations to deliver public services;
  • the ratio (expressed as a percentage) of the number of local employees compared to the total number of people employed in a given province: this indicator shows the contribution of local public administrations to the total volume of jobs in the said province.
Generally speaking, in Canada, the number of local government employees grew more rapidly than the population between 1981 and 2010, thus spurring the capacity of these administrations to provide public services. Nonetheless, the most recent datasets (from 2010) provide evidence of major differences between the provinces.

  Local Government Employees per 1000 Inhabitants


Source: Statistics Canada, E-STAT, Tables 183-0002 (updated July 7, 2011) and 051-0001 (updated July 5, 2011).

Ontario and Alberta are home to municipalities and supra-local bodies having a capacity to provide services higher than the Canadian average. In Ontario, this situation stems from the transfer of certain responsibilities from the provincial government to the municipalities, particularly in respect of social services. As regards this indicator, Quebec and Manitoba occupy a median position between, at one end, Ontario, Alberta, Saskatchewan and Nova Scotia and, at the other end, British Columbia and the Atlantic provinces other than Nova Scotia, where historically municipalities have had a relatively limited administrative capacity. In addition, between 1981 and 2010, variations appear that are more considerable in some provinces showed than in others. This is particularly the case of Nova Scotia, whose local administration workforce per 1000 inhabitants rose from 7.1 in 1981 to 19.1 in 2010 – an increase of 170%. Other provinces also experienced significant increases, including Prince Edward Island (+100%), Saskatchewan (+87%), Newfoundland and Labrador (+85%) and Alberta (+76%). For the same period, only the three most heavily populated provinces posted increases lower than the Canadian average of 51 %, with growth on the order of 42% for Ontario and 34% for Quebec and British Columbia.

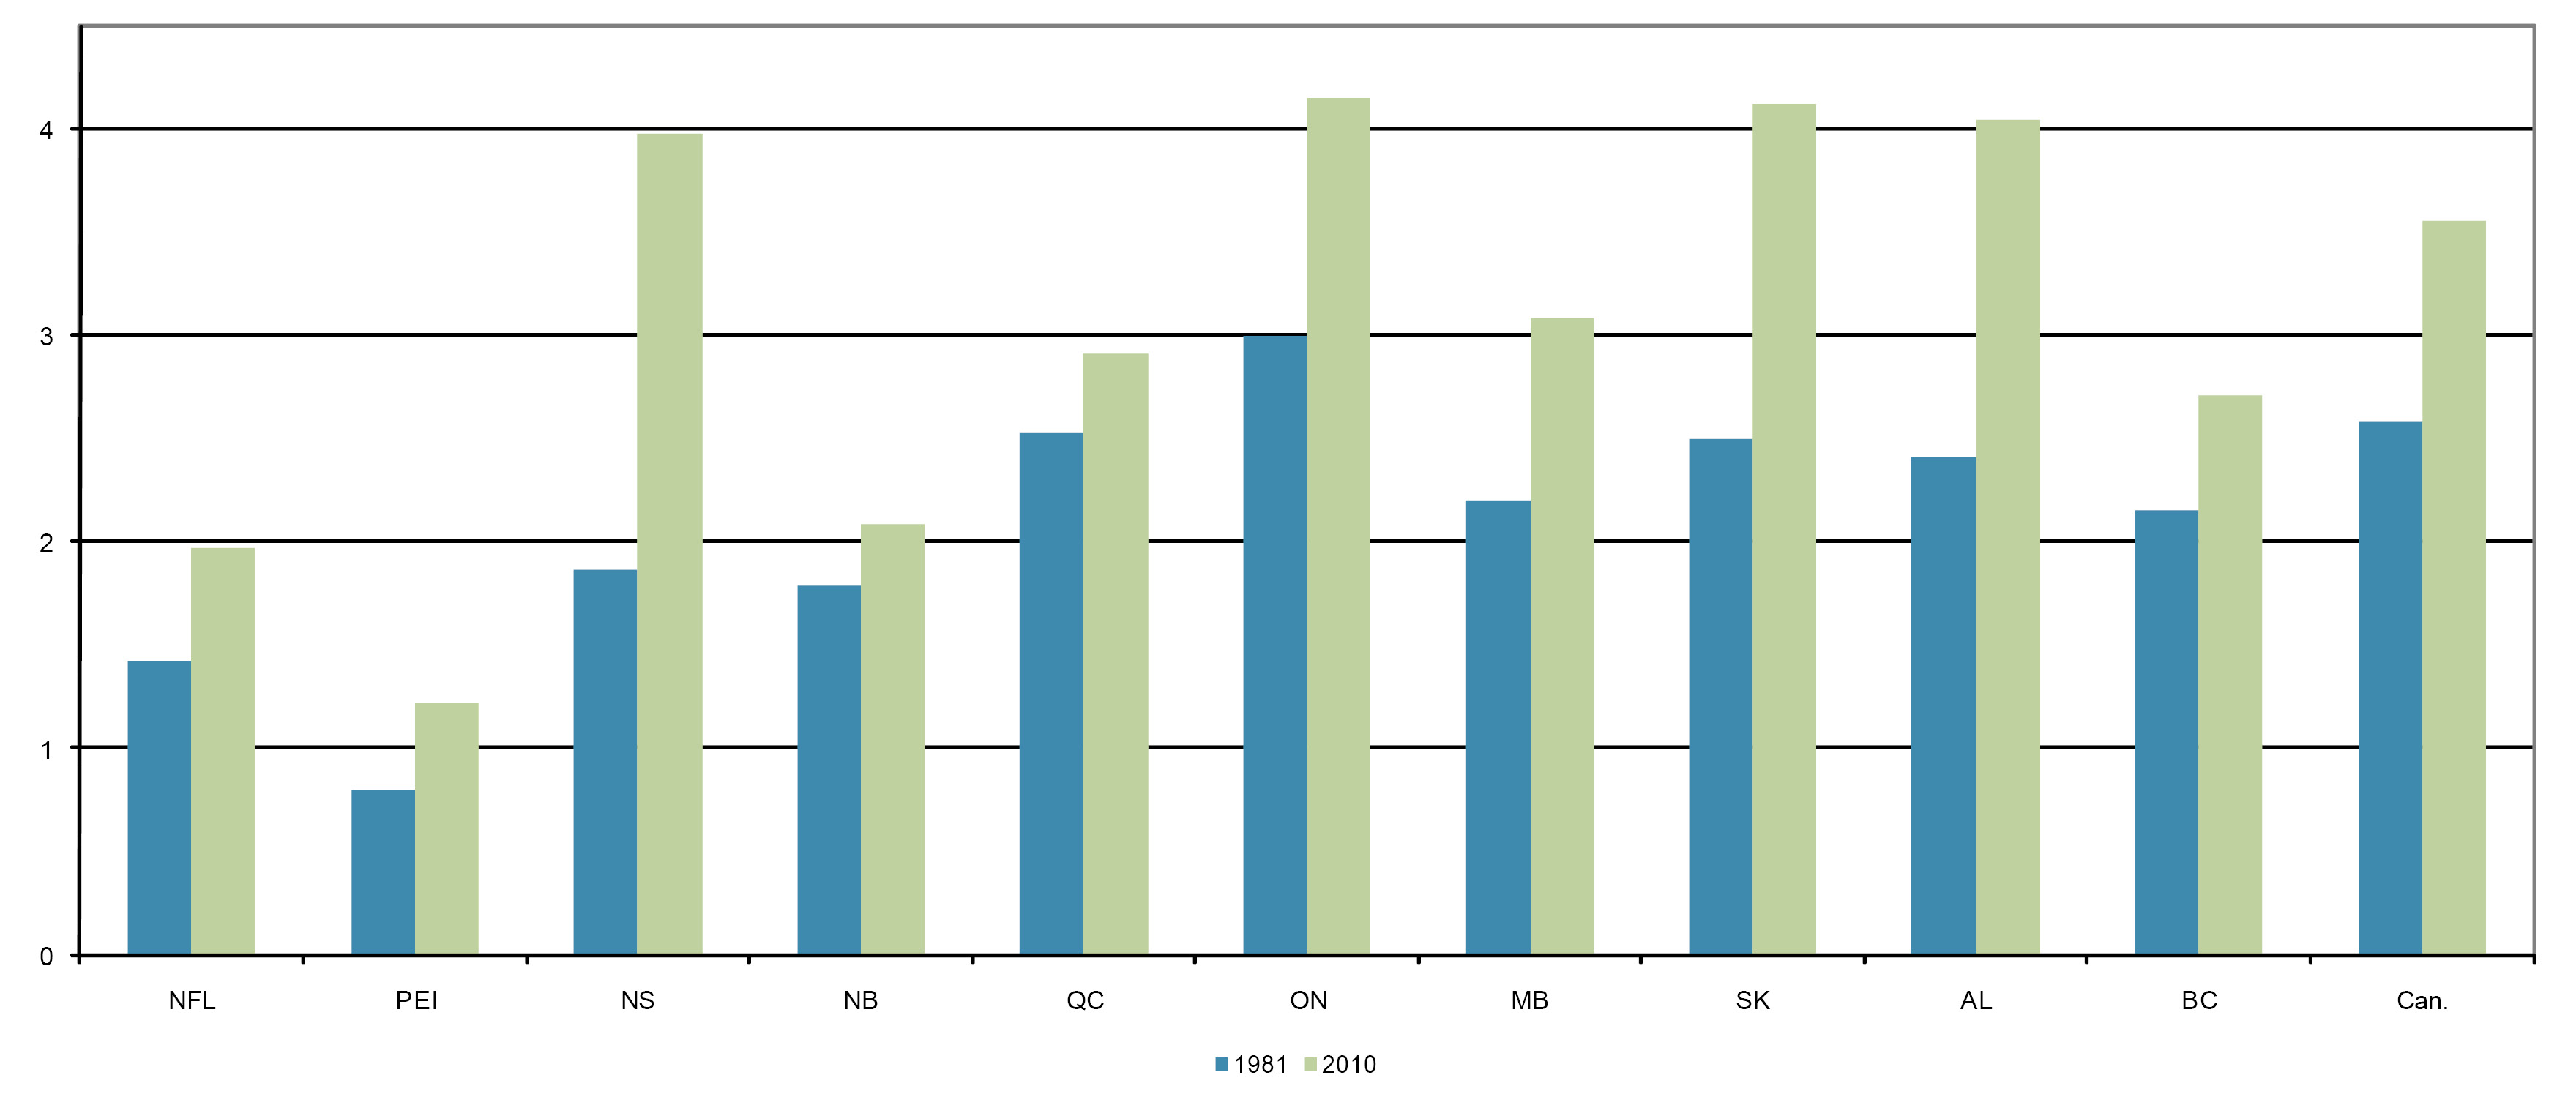
Local Government Employment as Share of Total Employment (%)


Source: Statistics Canada, E-STAT, Tables 183-0002 (updated July 7, 2011) and 282-0002 (updated July 5, 2011).

Similar observations can be made on the basis of the share of local administration employment as a percentage of total employment for a given province. In some provinces, like Quebec and British Columbia, the differences between the data reported for 1981 and that of 2010 are less significant for this indicator than for the indicator relating to the population of the province – meaning that employment in this sector has grown relatively faster than the population in both these provinces.